Container Monitoring
Daemon.json
container 모니터링을 하는 방법 중에서, 한가지는 docker daemon에 직접 아래의 스크립트를 작성해하면 됩니다.
vi /etc/docker/daemon.json
후에
{
	... ,
	"metrics-addr":"0.0.0.0:4999",
	"experimental":true
}
위의 두 줄을 추가 작성해주면 됩니다.
그 후에 daemon을 수정한 경우에는 docker daemon을 restart를 해줘야합니다.
즉, docker의 재시작이 필요합니다.
systemctl restart docker.service
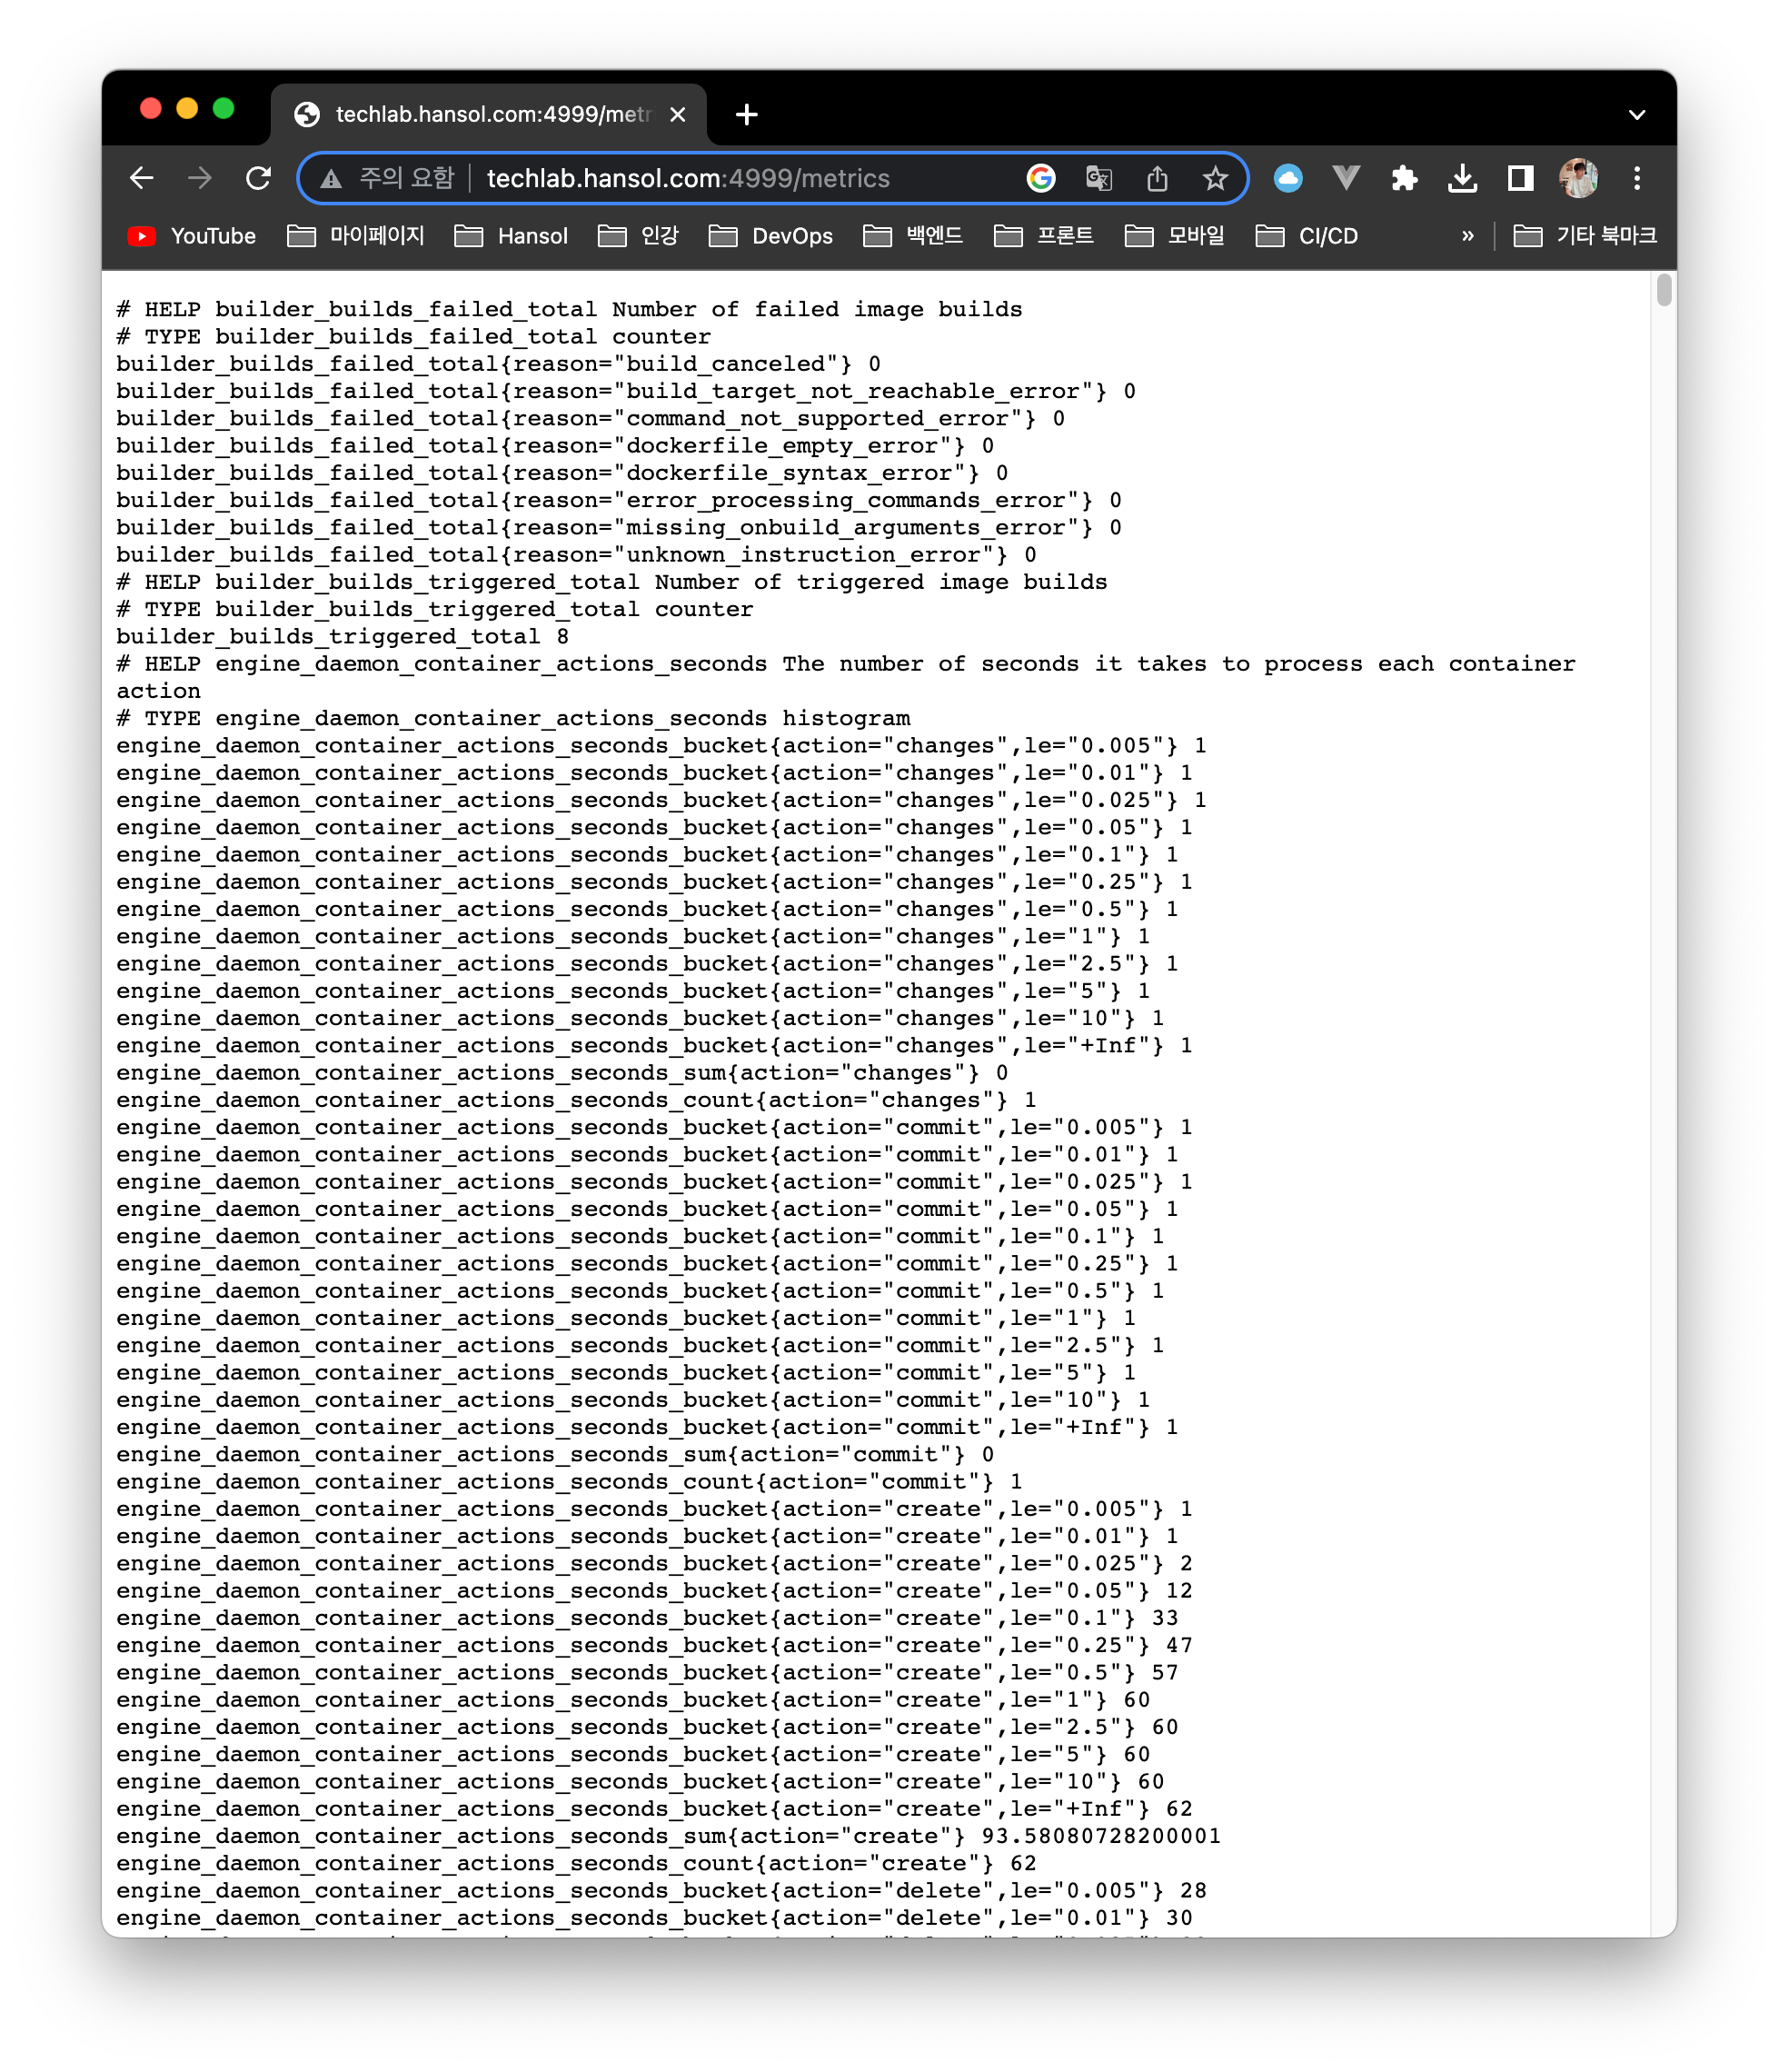
를 하게 된다면, 왼쪽의 주소로 들어간다면 정상적으로 metric데이터가 출력 되는 것을 확인 할 수 있습니다.
grafana dashboard id : 1229
http://[설정을 적용한 HOST IP]:4999/metrics
폴더 및 파일 구조
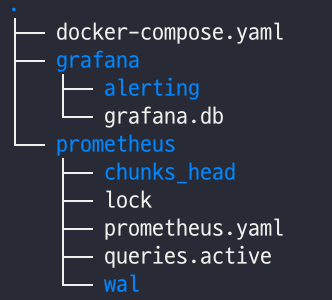
폴더 구조는 아래와 같으며, 실제로 필수적인 요소는
docker-compose.yaml과 prometheus/prometheus.yaml 입니다.
나머지는 docker가 알아서 만들어주기 때문에, 필수적으로 구성하지 않아도 됩니다.
코드 구성
docker-compose.yaml
version: "3"
services:
	prometheus:
	image: prom/prometheus
	restart: unless-stopped
	user: 1000:1000
	ports:
		- 9090:9090
	volumes:
		- ./prometheus/prometheus.yaml:/etc/prometheus/prometheus.yaml
		- ./prometheus:/prometheus
	command:
		- --config.file=/etc/prometheus/prometheus.yaml
		- --storage.tsdb.path=/prometheus
		- --storage.tsdb.retention.time=90d # 90일보다 오래된 metrics는 삭제
		- --storage.tsdb.retention.size=10GB # 10GB를 넘을 시 오래된 metrics 삭제
		- --web.console.libraries=/usr/share/prometheus/console_libraries
		- --web.console.templates=/usr/share/proemtheus/consoles
		- --web.enable-admin-api

	grafana:
		image: grafana/grafana
		restart: unless-stopped
		user: 1000:1000
	ports:
		- 3000:3000
	volumes:
		- ./grafana:/var/lib/grafana
	environment:
		- GF_SECURITY_ADMIN_USER=admin # grafana 사용자 이름
		- GF_SECURITY_ADMIN_PASSWORD=admin # grafana 사용자 비밀번호
		- GF_USERS_ALLOW_SIGN_UP=false
prometheus/prometheus.yaml
# my global config
global:
	scrape_interval: 15s # Set the scrape interval to every 15 seconds. Default is every 1 minute.
	evaluation_interval: 15s # Evaluate rules every 15 seconds. The default is every 1 minute.
# scrape_timeout is set to the global default (10s).
# Attach these labels to any time series or alerts when communicating with
# external systems (federation, remote storage, Alertmanager).
external_labels:
	monitor: 'codelab-monitor'

# Load rules once and periodically evaluate them according to the global 'evaluation_interval'.
rule_files:
	# - "first.rules"
	# - "second.rules"

# A scrape configuration containing exactly one endpoint to scrape:
# Here it's Prometheus itself.
scrape_configs:
	# The job name is added as a label `job=<job_name>` to any timeseries scraped from this config.
	- job_name: 'prometheus'
		# metrics_path defaults to '/metrics'
		# scheme defaults to 'http'.
		static_configs:
			- targets: ['localhost:9090']

	- job_name: 'docker'
# metrics_path defaults to '/metrics'
# scheme defaults to 'http'.
		static_configs:
			- targets: ['192.168.245.126:4999']

	- job_name: 'node-exporter'
		static_configs:
			- targets: ['192.168.245.126:9100']
cAdvisor-Container
위의 방법은 구축을 하기 위해서 docker daemon을 건드려야 한다는 위험성이 있습니다.
docker daemon을 재 시작해야 한다는 위험성과 외부로 해당 정보가 노출 된다는 단점이 존재합니다
cAdvisor를 이용하게 된다면, container 환경에서 해당 정보들을 받아올 수 있기에**, 외부 port 노출이 불 필요**하며,
또한 docker를 재시작할 이유가 없기에, 안정적으로 Monitoring을 구축 할 수 있습니다.
cAdvisor는 따로 작업 할 내용이 없으며, docker-compose에 추가적인 작성만 해주면 됩니다.
폴더 구조
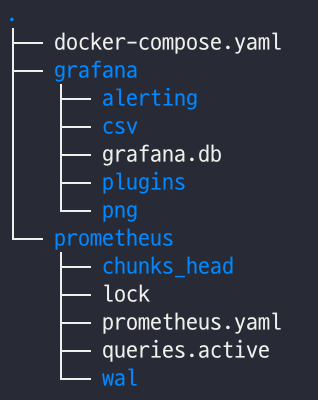
daemon 폴더 구조와 마찬가지로, cAdvisor도 마찬가지로 필수적으로 가져야하는 파일은
docker-compose.yaml , prometheus/prometheus.yaml
두가지 파일 정도 입니다.
파일 구성
docker-compose.yaml
version: '3'
services:
	cadvisor:
		image: google/cadvisor:latest
		container_name: cadvisor
		ports:
			- 8080
		volumes:
			- /:/rootfs:ro
			- /var/run:/var/run:ro
			- /sys:/sys:ro
			- /var/lib/docker/:/var/lib/docker:ro
			- /dev/disk/:/dev/disk:ro
		restart: always
		networks:
			- monitoring-network
	prometheus:
		image: prom/prometheus
		container_name: prometheus
		restart: unless-stopped
		user: 1000:1000
		ports:
			- 9090:9090
		volumes:
			- ./prometheus/prometheus.yaml:/etc/prometheus/prometheus.yaml
			- ./prometheus:/prometheus
		command:
			- --config.file=/etc/prometheus/prometheus.yaml
			- --storage.tsdb.path=/prometheus
			- --storage.tsdb.retention.time=90d # 90일보다 오래된 metrics는 삭제
			- --storage.tsdb.retention.size=10GB # 10GB를 넘을 시 오래된 metrics 삭제
			- --web.console.libraries=/usr/share/prometheus/console_libraries
			- --web.console.templates=/usr/share/proemtheus/consoles
			- --web.enable-admin-api
		networks:
			- monitoring-network
	grafana:
		image: grafana/grafana
		container_name: grafana
		restart: unless-stopped
		user: 1000:1000
		ports:
			- 3000:3000
		volumes:
			- ./grafana:/var/lib/grafana
		environment:
			- GF_SECURITY_ADMIN_USER=admin # grafana 사용자 이름
			- GF_SECURITY_ADMIN_PASSWORD=admin # grafana 사용자 비밀번호
			- GF_USERS_ALLOW_SIGN_UP=false
		depends_on:
			- prometheus
		networks:
			- monitoring-network

networks:
	monitoring-network:
		driver: bridge
prometheus/prometheus.yaml
global:
	scrape_interval: 15s

	external_labels:
		monitor: 'uzukilive-monitor'

scrape_configs:
	- job_name: 'cAdvisor'
	scrape_interval: 5s
	static_configs:
		- targets: ['cadvisor:8080']
위와 같이 셋팅하게 된다면, cAdvisor의 DashBoard ID 14282 를 Import하고 난 후에 아래의 화면이 뜨게 됩니다.

자세한 코드는 아래의 링크를 눌러주세요 Container Monitoring2 SRC